

 Mein moderner Terminal-Dev-Stack
Neovim, AstroNvim, tmux, moderne Language Server und eine neue Generation erstaunlich guter Terminal-Werkzeuge decken inzwischen fast meinen gesamten Entwicklungsalltag ab. Und ausgerechnet KI beseitigt einen großen Teil der früheren Hürde: Konfiguration, Orientierung und Lernen werden plötzlich erheblich einfacher.
Weiterlesen
Mein moderner Terminal-Dev-Stack
Neovim, AstroNvim, tmux, moderne Language Server und eine neue Generation erstaunlich guter Terminal-Werkzeuge decken inzwischen fast meinen gesamten Entwicklungsalltag ab. Und ausgerechnet KI beseitigt einen großen Teil der früheren Hürde: Konfiguration, Orientierung und Lernen werden plötzlich erheblich einfacher.
Weiterlesen
Friends have developed a habit of asking me about the weather.
Not in the conversational “nice weather today” sense. More along the lines of:
“It says rain at five. Do you think it will actually rain?”
Or:
“There is a thunderstorm warning. Is that storm coming here?”
Apparently my answer is often more useful than whatever their iPhone, Android phone or random weather app is telling them.
There is no secret forecasting model running in my basement. I am also not sitting there manually solving atmospheric equations.
I simply don't rely on one weather icon.
When I actually care about the weather, I combine several different kinds of information: official forecasts, radar, warnings, lightning observations, larger-scale model views and local measurements.
The important part is knowing which source answers which question.
That distinction turns weather forecasting from “my app says rain” into something considerably more useful.
And once you understand the basic method, you can use it almost anywhere.
The short version
If you don't want the meteorological rabbit hole, this gets you most of the way there:
| What I want to know | What I look at |
|---|---|
| What is happening right now? | Local observations, radar, weather station |
| Will that rain reach me in the next hour? | Animated precipitation radar |
| Is that thunderstorm actually active? | Radar + LightningMaps |
| Is potentially dangerous weather developing? | Official warnings + current observations |
| What will tomorrow probably be like? | Official local forecast |
| How about the next few days? | Official forecast + model context if it matters |
| Why do forecasts disagree? | Model comparison, probabilities and uncertainty |
| What is happening at my exact home? | My own weather station |
| Is today's weather unusual? | Historical weather/climate data |
For Germany, my default combination is especially simple:
DWD WarnWetter + LightningMaps.org + my own personal weather station.
For the larger picture, I often add Windy.
That's already a very capable setup.
But the interesting part is why it works.
Forecast, nowcast and observation are different things
A major source of confusion is that consumer weather apps compress several fundamentally different things into one interface.
You see:
17:00 — 🌧️ — 70%
It looks wonderfully precise.
But atmospheric reality is not an appointment calendar.
I find it more useful to think in three layers.
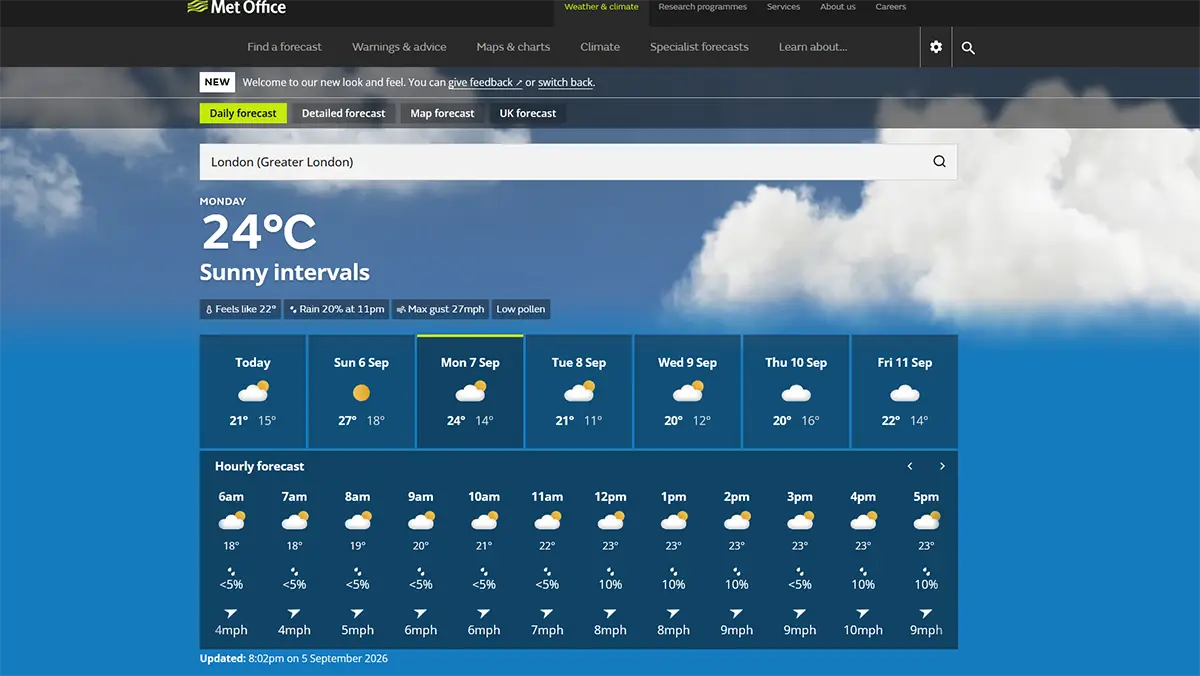
1. Forecast
What is likely to happen later?
This is where numerical weather prediction models, ensembles, observations and meteorological interpretation come together.
Forecasts are what you primarily care about when deciding whether tomorrow will be warm, whether a front will arrive on Friday, or whether the weekend might be wet.
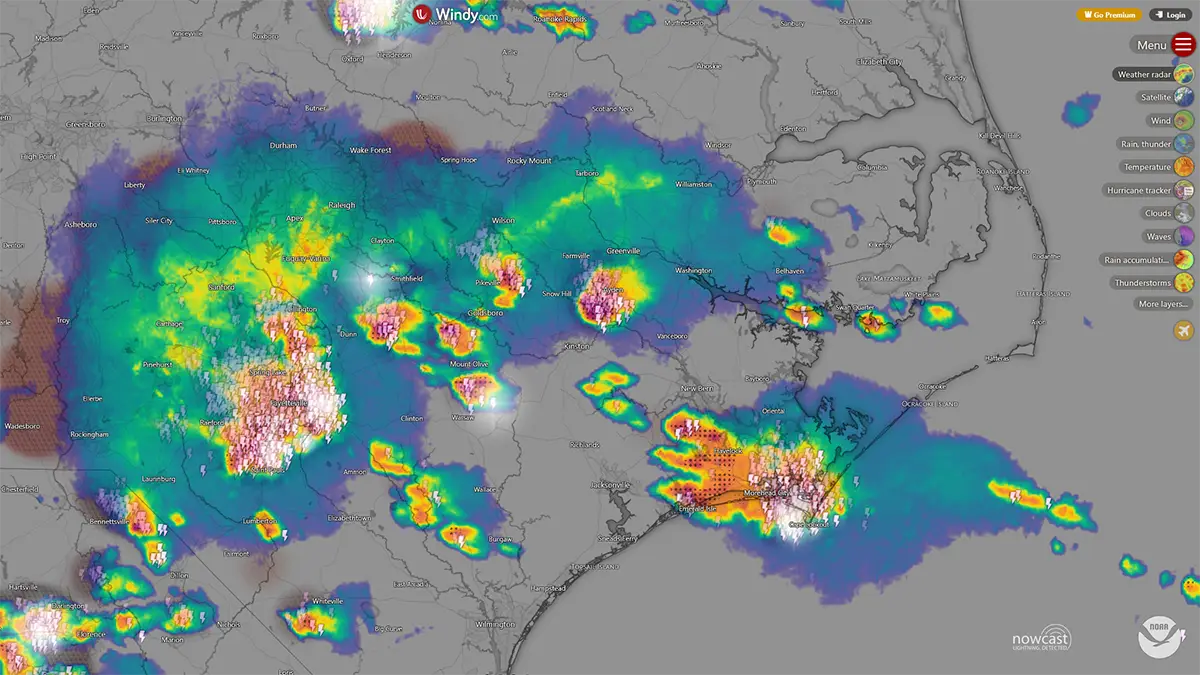
2. Nowcast
What is likely to happen over roughly the next minutes to couple of hours?
Now the atmosphere itself starts giving us much more information.
Radar can show where precipitation actually exists, where it has been moving, whether it is intensifying, and how its structure is changing.
For “Will it rain at my house in 30 minutes?”, that can be enormously more useful than yesterday's forecast.
3. Observation
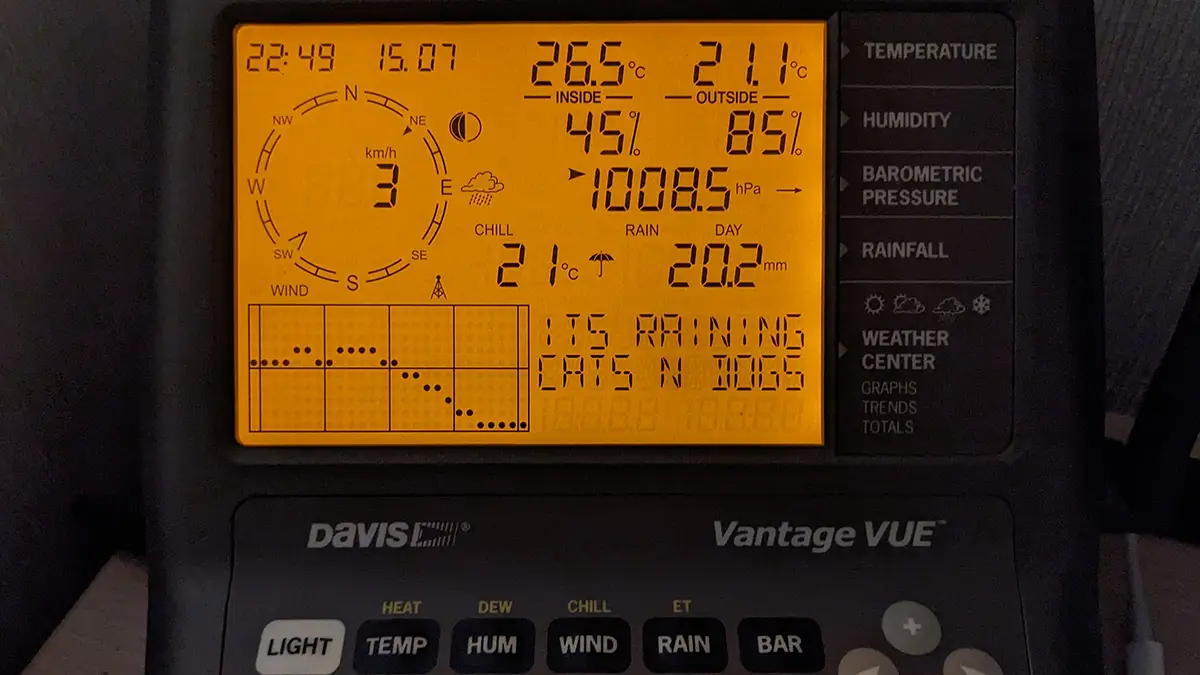
What is happening right now?
Weather stations measure temperature, humidity, pressure, wind and precipitation.
Radar observes precipitation structures.
Lightning networks detect actual electrical activity.
Satellite imagery observes clouds and atmospheric patterns from above.
As an event gets closer, I progressively shift my attention from forecast toward observation and nowcasting.
That is probably the single most useful idea in this entire post.
A weather forecast is not a timetable
Suppose your weather app tells you:
Rain at 17:00.
It is very easy to mentally translate that into:
Rain will begin at approximately 17:00 at my location.
That degree of certainty usually does not exist.
The underlying forecast may contain uncertainty in:
- whether precipitation develops at all,
- its exact location,
- timing,
- intensity,
- movement,
- duration,
- and how the weather system evolves between now and then.
For broad weather systems, forecasts can be impressively good.
For small convective showers and thunderstorms, moving something only a few kilometers can turn your personal result from “violent thunderstorm” into “sunny evening”.
This is particularly visible in summer.
At 08:00, I might accept that thunderstorms are likely somewhere in my area during the afternoon.
At 15:00, I start looking carefully at radar.
At 16:30, if somebody asks whether they can walk the dog before the rain arrives, the current radar evolution can be much more important than an icon generated many hours earlier.
Forecasting becomes a process of updating your model of reality as new evidence arrives.
Which sounds terribly grandiose for deciding whether you need an umbrella, but that is essentially what it is.
In Germany, start with DWD WarnWetter
If you're in Germany and regularly care about the weather, my first recommendation is very simple:
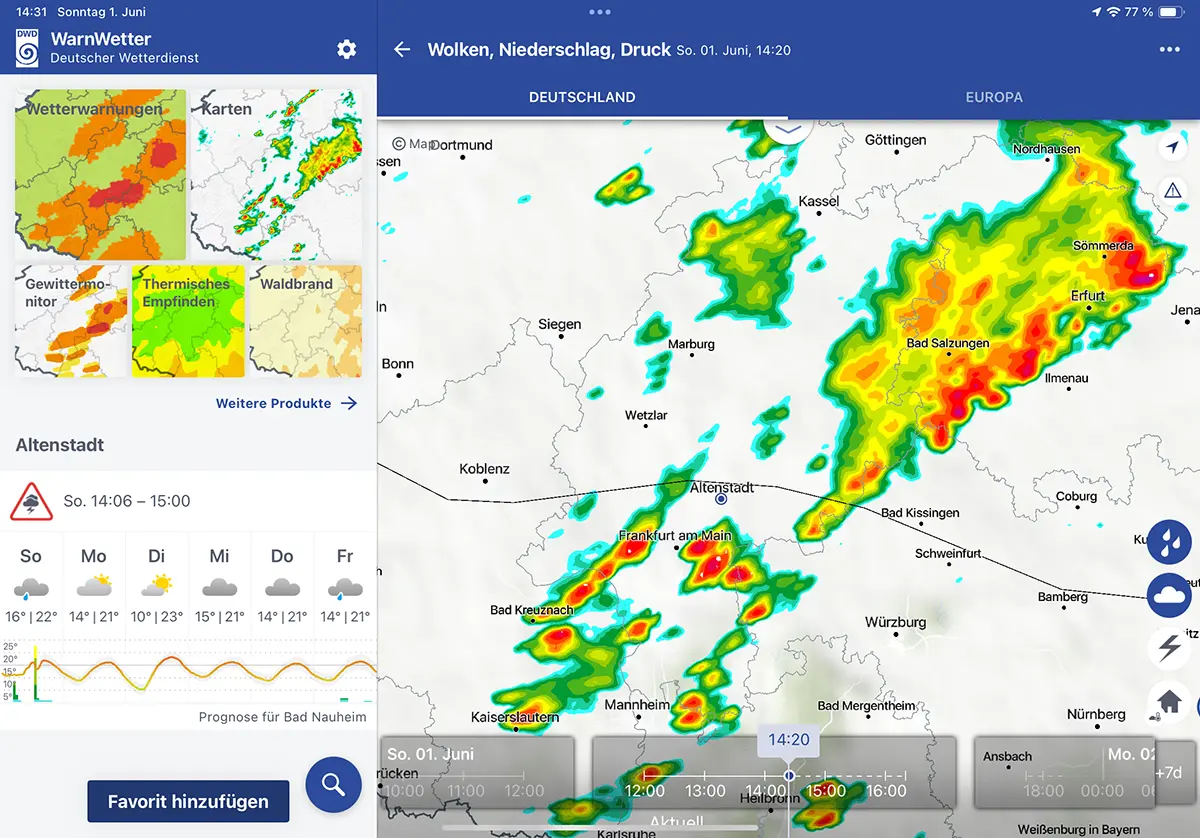
Install the official WarnWetter app from the Deutscher Wetterdienst.
The DWD is Germany's national meteorological service. It operates the underlying observation, forecasting and warning infrastructure rather than merely putting another user interface on somebody else's forecast.
The free WarnWetter version is already useful for official warnings. The full version is currently available as a small one-time in-app purchase and unlocks a surprisingly extensive weather toolkit.
Among other things, it includes:
- precipitation radar,
- forecasts,
- lightning information,
- satellite/cloud data,
- temperature,
- wind,
- weather-station measurements,
- precipitation probabilities,
- pressure,
- humidity and dew point,
- thunderstorm monitoring,
- warnings,
- and a timeline that moves from observations into forecasts.
For what it costs, I consider it one of those unusually good pieces of public digital infrastructure.
The app is much better than the DWD website for local inspection
The DWD website itself contains an extraordinary amount of meteorological information.
The problem is presentation.
Many products are still exposed as traditional weather maps, generated graphics, specialist pages and relatively small animations.
They are useful if you know what you are looking for, but they are not always pleasant for answering a very local question.
I still wish the DWD would build a beautiful, modern, high-resolution web application around all this data.
WarnWetter gets much closer.
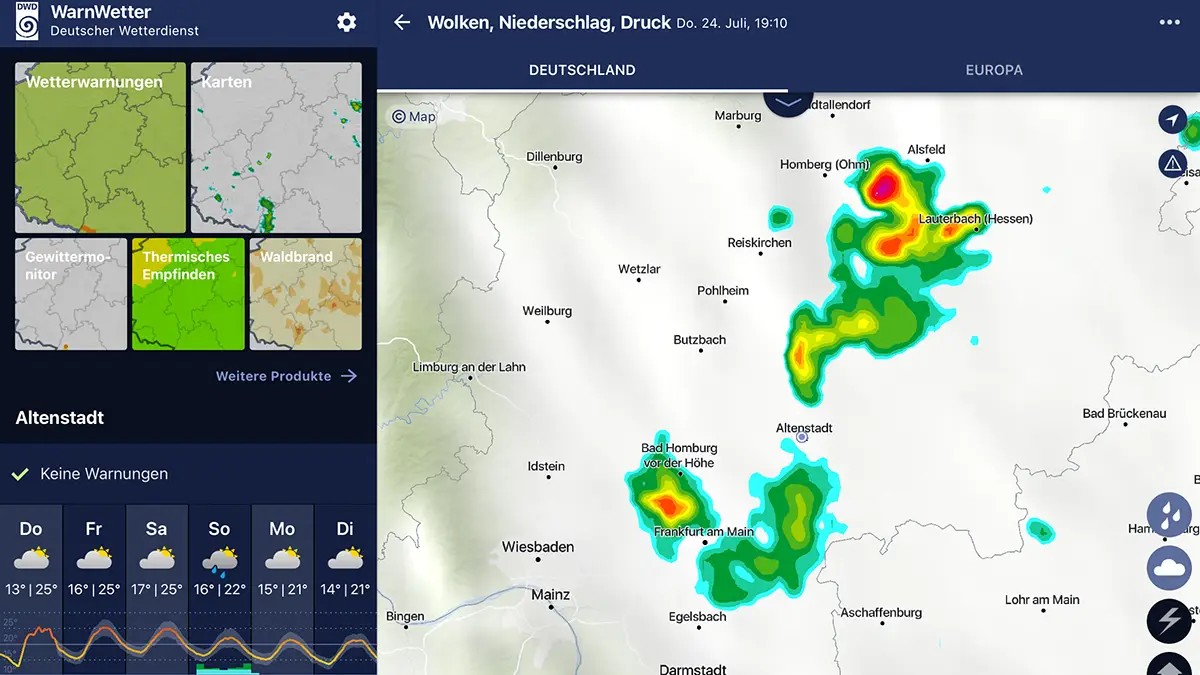
On the phone or tablet I can zoom deeply into my actual area, move through the precipitation timeline and inspect the local situation at a useful geographic scale.
A map of the entire state of Hesse can tell me that rain exists somewhere.
A zoomed radar view can tell me that the interesting cell is west of Frankfurt, moving northeast, and might or might not become my problem.
Those are very different levels of information.
How I actually read a rain radar
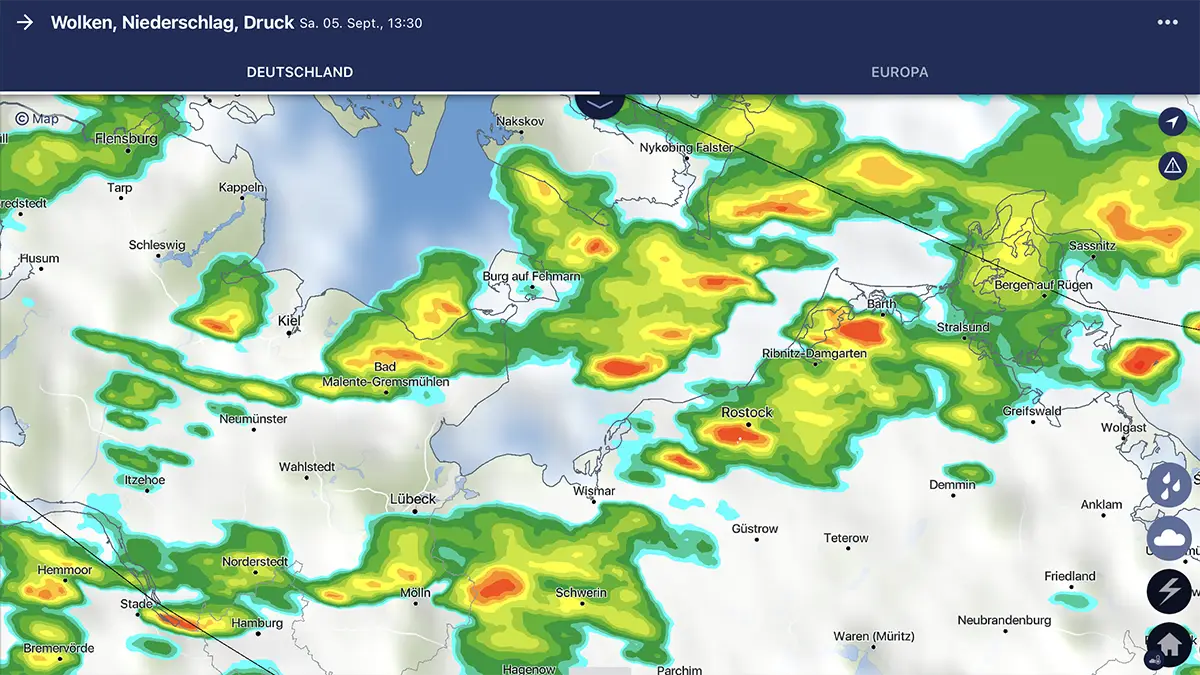
Rain radar is probably the biggest upgrade you can make from simply reading a weather forecast.
But there is a trap.
A radar animation often shows measured history followed by a predicted continuation.
Humans are extremely good at seeing motion, so we naturally extrapolate:
The blob is moving this way. Therefore the blob will continue moving exactly this way.
Often that is a useful approximation.
It is not a law.
When I inspect radar, I am really asking several questions:
Where is the precipitation moving?
Start with direction.
If an extended band has consistently traveled east for the last hour, continuing that movement for another 20 minutes is not unreasonable.
How fast is it moving?
A slow-moving summer shower and a fast-moving frontal rain band imply very different timing.
Is it growing or decaying?
Don't look only at the position.
A cell may be getting larger, darker and more organized.
Or it may be visibly falling apart.
Is its structure changing?
Convective cells can split, merge, regenerate, change direction or produce new development nearby.
What arrives at your location may look very different from what you saw 30 minutes earlier.
What is the surrounding weather doing?
A single cell is not isolated from the atmosphere around it.
Terrain, valleys, mountain ranges, local heating, coastlines and larger mesoscale structures can influence how weather develops.
If there is a mountain range between you and the incoming precipitation, for example, simply drawing a straight line on the map may not tell the whole story.
Local weather can occasionally behave in surprisingly persistent ways around terrain and other geographic structures.
I am more cautious about turning these observations into folk meteorology — “storms always split at this river” is exactly the sort of rule that may sound convincing until it doesn't — but geography absolutely matters.
Radar is excellent evidence, not a video recording of the future
Consider two situations.
Situation A: an organized rain band
It has been moving steadily east for the last 90 minutes.
Its structure changes only slowly.
You are 30 kilometers east of it.
Here, extrapolation can be quite useful.
Situation B: scattered summer thunderstorms
Cells are appearing and disappearing rapidly.
Some intensify within minutes.
New precipitation develops ahead of existing cells.
Others collapse.
Here, extending the last radar frame forward as though you're tracking trains on a railway becomes much less reliable.
Both situations can produce the same little rain icon in your weather app.
They require very different interpretation.
Weather warnings: take them seriously, but understand what they mean
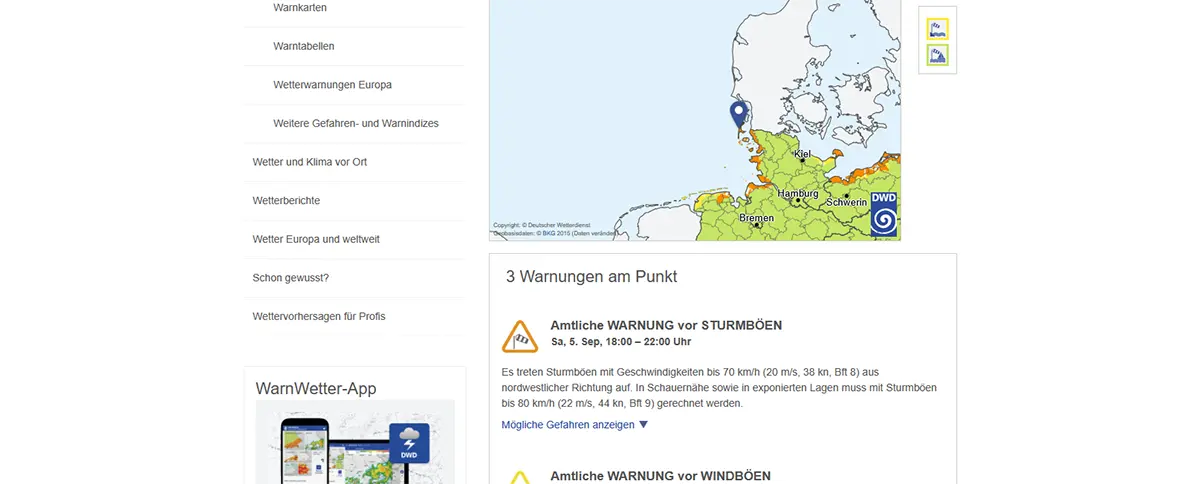
WarnWetter is also where I primarily receive German severe-weather warnings.
This creates another common misunderstanding.
Someone gets a thunderstorm warning for their district.
Nothing happens at their house.
Eventually they conclude:
“These warnings are always exaggerated.”
That's the wrong lesson.
A warning usually covers an area, while dangerous weather — especially thunderstorms — can be highly localized.
A severe cell may cross one part of your district while ten kilometers away somebody gets moderate rain.
The warning can still have been completely justified.
Likewise, a warning may describe the possibility of:
- severe wind gusts,
- hail,
- intense rainfall,
- lightning,
- or other hazardous conditions,
while your own location eventually receives something much less dramatic.
That uncertainty is inherent in the phenomenon.
My practical rule is:
A warning tells me to pay attention. Radar, lightning and observations tell me how the situation is currently developing.
I never consider a warning proof that my garden will receive the advertised weather.
I also never dismiss it merely because the last warning produced nothing exciting at my house.
Those are two different errors.
Thunderstorms: LightningMaps.org is one of my favorite weather tools
For thunderstorms I almost always add LightningMaps.org.
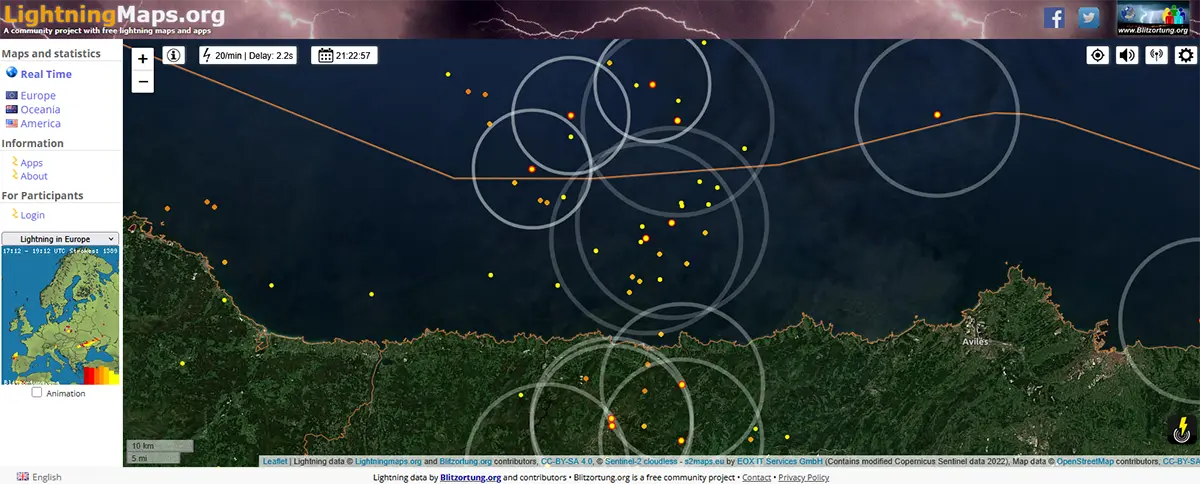
It visualizes lightning detections from the community-driven Blitzortung.org network in near real time.
It is a wonderful project.
Where radar tells me about precipitation structures, lightning data tells me where storms are actually electrically active.
That distinction matters.
A dramatic radar echo may contain little lightning.
Another cell may suddenly begin producing frequent strikes, making its convective activity very obvious.
During thunderstorms I therefore tend to look at both:
radar + lightning.
LightningMaps also has one of my favorite small visualisations: expanding circles showing the approximate propagation of thunder away from a detected strike.
Seeing that circle approach your position roughly when the actual thunder reaches you is a wonderfully tangible demonstration that light reaches you essentially immediately while sound takes its time.
Of course, LightningMaps is a community observation project rather than an official warning authority.
For safety-critical information, I still use the official meteorological service.
But as a real-time observational tool, it is excellent.
Windy: when I want to see the weather system rather than the weather icon
For a bigger picture, I often use Windy.
Windy is less interesting to me as yet another place that can tell me tomorrow will be 23°C.
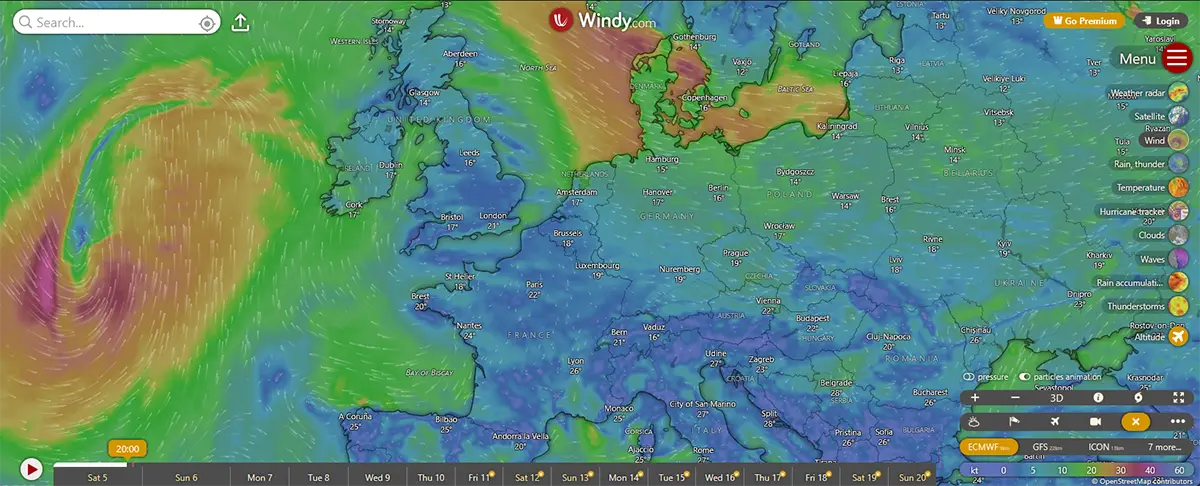
Its strength is showing the structure of the atmosphere.
Instead of:
Tuesday: cloudy.
I can inspect:
- pressure,
- wind fields,
- precipitation,
- temperature,
- cloud layers,
- fronts and broader atmospheric patterns,
- and different numerical forecast models.
Suddenly the weather stops looking like seven isolated daily icons.
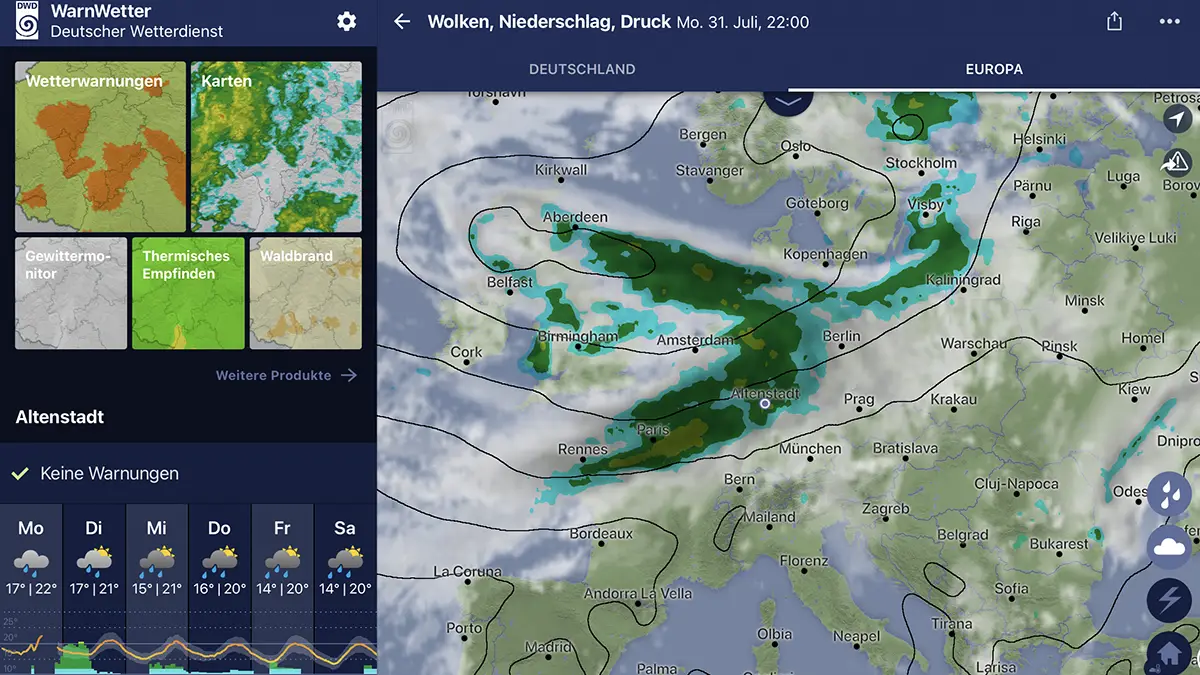
You can see that a low-pressure system is moving across Europe.
You can see where air masses interact.
You can see whether the wind turns after a frontal passage.
And you can see that different forecast models sometimes disagree.
That last part is important.
Strategische Beratung
Wenn Technologieentscheidungen komplex werden
Ein wesentlicher Teil meiner Arbeit besteht darin, komplexe technische Fragestellungen zu strukturieren, Annahmen zu hinterfragen und aus Unsicherheit belastbare Entscheidungen abzuleiten.
When forecasts disagree, that is information
If one service predicts rain at 14:00 and another predicts rain at 19:00, the instinctive question is:
Which one is right?
Sometimes a better question is:
Why is this situation uncertain?
Numerical weather models are simulations of an absurdly complicated physical system based on incomplete observations and finite computational resolution.
Different models can produce different solutions.
If several models broadly agree on the evolution of a large weather system, I am more confident in the broad result.
If they disagree strongly about the position or timing of precipitation, I become much more cautious about exact claims.
This is where sites such as Windy or the multi-model views offered by services such as meteoblue become useful for technically curious readers.
You do not need to become a meteorologist.
Simply learning to recognize agreement versus disagreement already improves how you interpret a forecast.
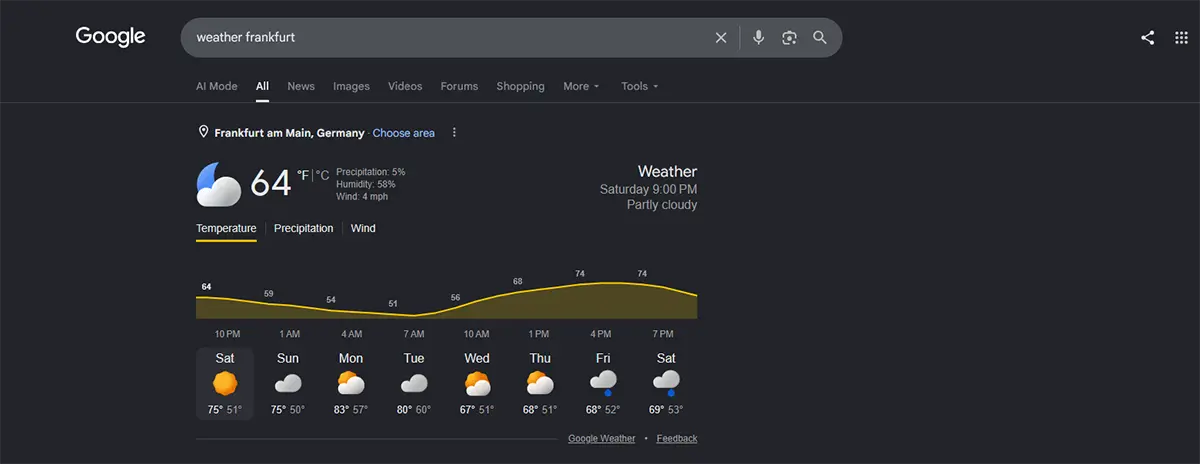
Yes, your phone's default weather app is still useful
None of this means Apple Weather, Google's weather results, AccuWeather, Yr or another consumer service is useless.
Quite the opposite.
If I want to know whether tomorrow is broadly going to be:
- 10°C or 25°C,
- sunny or overcast,
- dry or unsettled,
a normal consumer forecast is often perfectly adequate.
If I'm traveling and quickly search “weather Paris”, I am not offended when Google gives me a convenient summary.
The problem begins when the simplicity of the interface gets confused with certainty.
If all I need is:
“Probably around 22°C and cloudy tomorrow.”
the phone is fine.
If I am deciding whether to take a 40-minute bicycle ride while a colorful radar cell approaches from the west, I would like slightly more information.
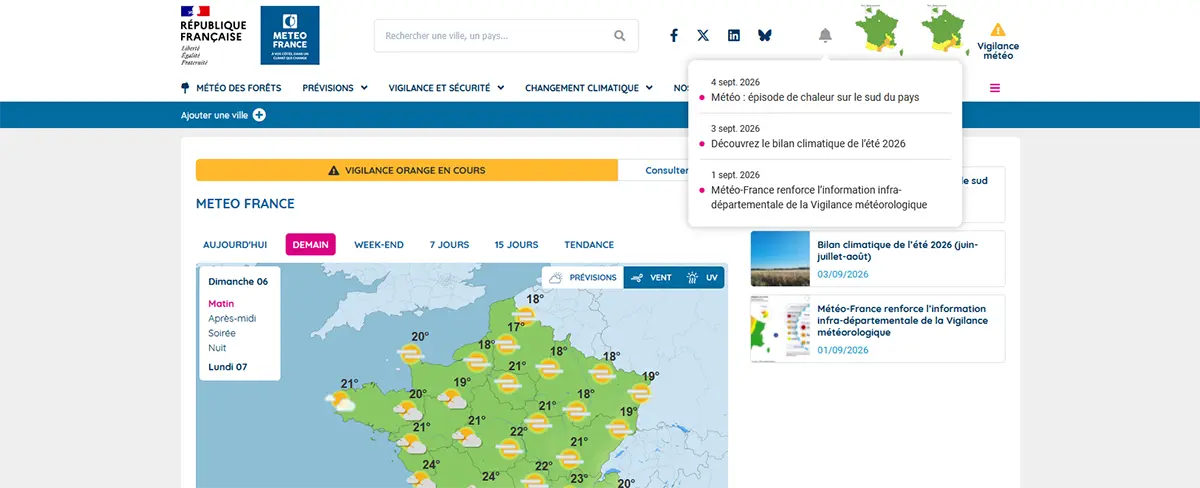
When traveling: start with the national weather service
My general rule abroad is surprisingly boring:
Find the country's official meteorological service.
Global weather platforms are extremely useful, but national services often have things a global consumer application cannot replicate as well:
- local radar networks,
- official warnings,
- national observation networks,
- local high-resolution models,
- regional expertise,
- terrain-specific products,
- marine or mountain forecasts,
- and direct integration into civil-protection systems.
In France, for example, I would rather start with Météo-France than depend exclusively on a generic global forecast.
In the United States, I want access to NOAA and the National Weather Service.
In Switzerland, MeteoSwiss.
The exact quality of the interfaces varies dramatically. “Official” certainly does not always mean “best designed”.
But I like knowing where the authoritative local information originates.
Useful official weather services around the world
This is not intended to list every meteorological organization on Earth. It is a pragmatic starting list covering much of Europe plus destinations particularly relevant from a German, British or North American perspective.
| Country | Official / primary meteorological source |
|---|---|
| 🇩🇪 Germany | DWD — Deutscher Wetterdienst / WarnWetter |
| 🇦🇹 Austria | GeoSphere Austria |
| 🇨🇭 Switzerland | MeteoSwiss |
| 🇫🇷 France | Météo-France |
| 🇮🇹 Italy | ItaliaMeteo / Meteo Aeronautica Militare |
| 🇪🇸 Spain | AEMET |
| 🇵🇹 Portugal | IPMA |
| 🇬🇧 United Kingdom | Met Office |
| 🇮🇪 Ireland | Met Éireann |
| 🇳🇱 Netherlands | KNMI |
| 🇧🇪 Belgium | Royal Meteorological Institute |
| 🇩🇰 Denmark | DMI |
| 🇳🇴 Norway | MET Norway / Yr |
| 🇸🇪 Sweden | SMHI |
| 🇫🇮 Finland | Finnish Meteorological Institute |
| 🇭🇷 Croatia | DHMZ |
| 🇬🇷 Greece | Hellenic National Meteorological Service |
| 🇹🇷 Türkiye | Turkish State Meteorological Service |
| 🇺🇸 United States | NOAA / National Weather Service |
| 🇨🇦 Canada | Environment and Climate Change Canada |
| 🇯🇵 Japan | Japan Meteorological Agency |
| 🇦🇺 Australia | Bureau of Meteorology |
| 🇳🇿 New Zealand | MetService |
Europe also has MeteoAlarm, which provides a useful cross-border view of official severe-weather warnings from participating national meteorological services.
That can be especially handy during road trips where weather does not care that you just crossed from Germany into Austria.
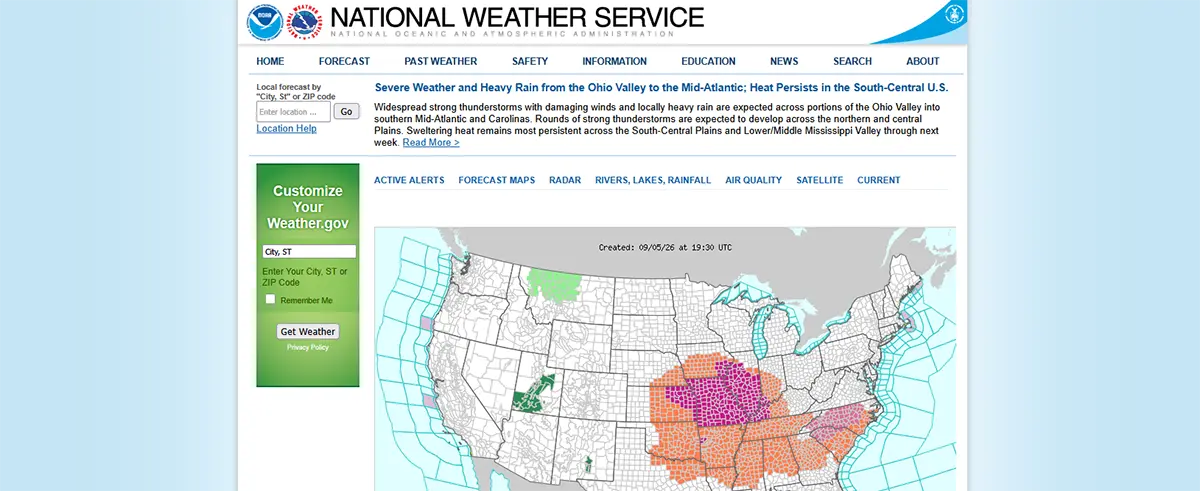
The US is a particularly interesting case
The United States has extraordinary public meteorological infrastructure through NOAA and the National Weather Service.
There are forecasts, observations, Doppler radar, warnings, detailed forecast discussions, hurricane information, severe-weather outlooks and enormous amounts of specialist data.
Yet, somewhat surprisingly, the National Weather Service still does not operate the kind of polished all-in-one official consumer smartphone app that DWD provides with WarnWetter.
So in the US I would be more willing to combine:
- NWS / weather.gov,
- official radar,
- local warnings,
- and a good third-party mobile interface.
The underlying public data is extremely capable even if the consumer-facing experience is fragmented.
For weather enthusiasts, the US system can become an enormous rabbit hole in its own right.
A personal weather station is surprisingly useful
So far almost everything has involved remote sensing or forecasts.
But there is another source:
your own garden.
You do not need a professional meteorological installation.
A simple outdoor temperature and humidity sensor is already useful.
Add pressure and you get another dimension.
Add rainfall and wind, and you suddenly have a fairly comprehensive local observing station.
The important conceptual distinction is:
A weather service estimates or measures a wider area. Your weather station measures your location.
That can be genuinely useful.
A nearby official station may sit:
- 15 kilometers away,
- at a different altitude,
- in a city,
- at an airport,
- on open terrain,
- or in a completely different local microclimate.
Your garden is your garden.
But sensor placement matters
There is one caveat that deserves much more attention than it usually gets.
Owning a temperature sensor does not automatically mean you are measuring representative air temperature.
The sensor sitting on your kitchen windowsill may primarily be measuring:
your kitchen windowsill.
A wall heated by afternoon sun can strongly distort temperature readings.
An unshielded sensor in direct sunlight can report nonsense.
A wind sensor between two houses tells you a lot about airflow between those houses, but considerably less about unobstructed regional wind.
A rain gauge beneath a tree has invented a new branch of hydrology.
You don't need to comply with every professional WMO siting standard to get useful personal data.
But you should understand what your sensors are actually exposed to.
A beautifully precise number can still be precisely wrong.
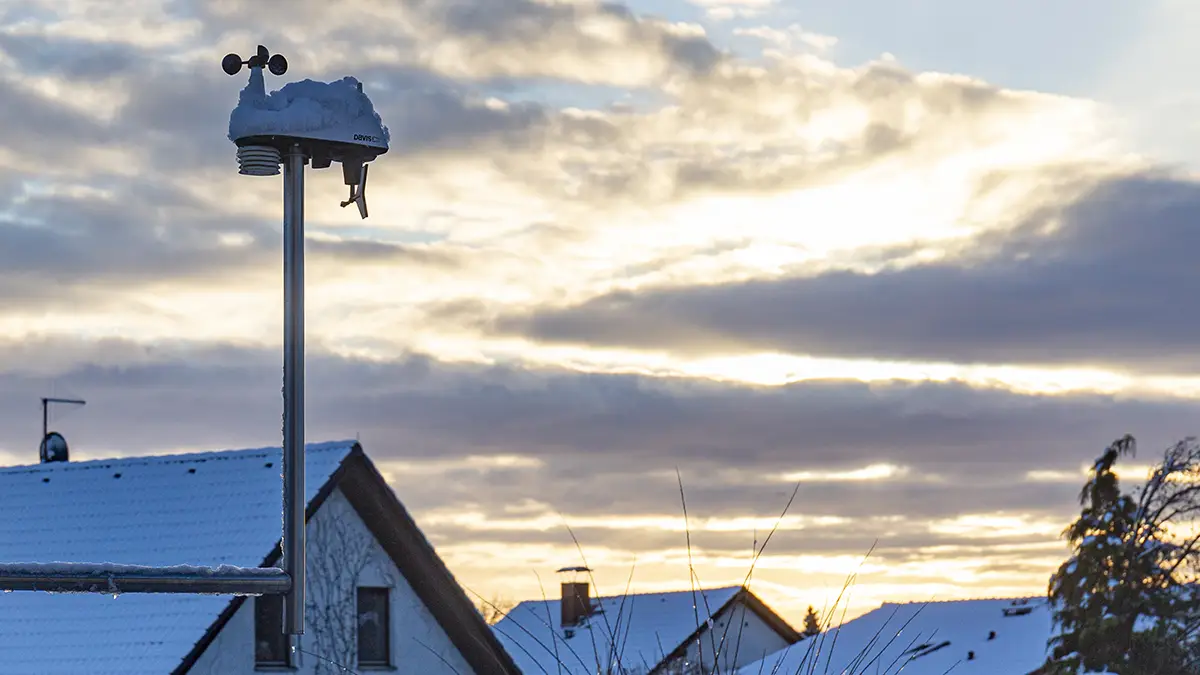
My own weather station got slightly out of hand
Naturally, I did not stop at an outdoor thermometer.
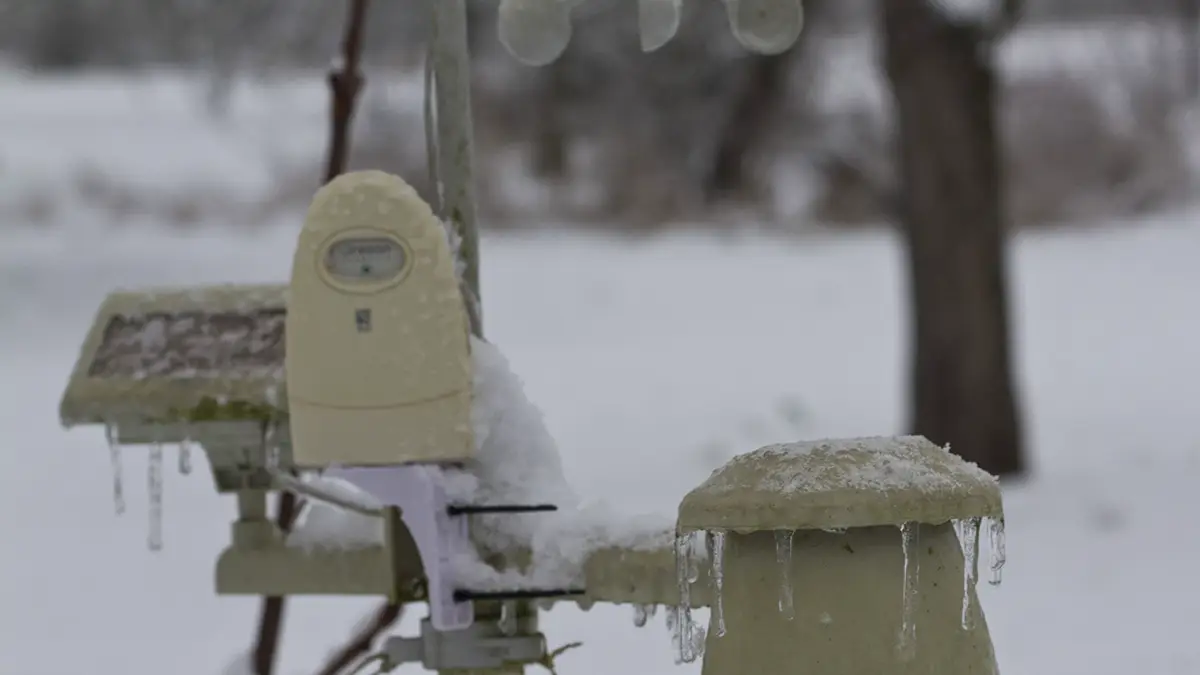
I have been running a proper personal weather station for many years.
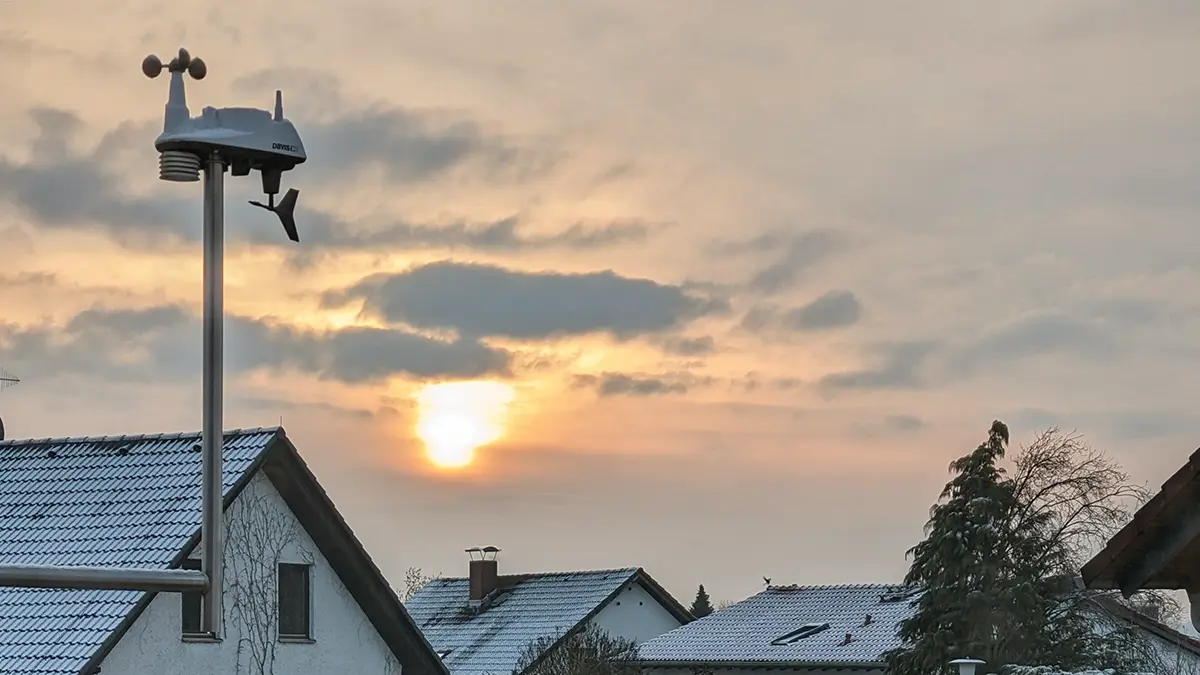
I started capturing its data continuously in April 2014. Since 2019, the physical station has been a Davis Vantage Vue.
The measurements are logged by a computer and processed using WeeWX, the excellent open-source weather-station software.
You can see the current data and archives on my live weather station.
That archive now contains more than a decade of local environmental history.
And this is where a personal weather station becomes much more interesting than a digital thermometer.
A decade of data changes the question
At the beginning you ask:
What is the temperature?
After several years you can ask:
Is this temperature unusual?
Then:
When was the last comparable September day?
Or:
How many tropical nights did we have this summer?
Or:
How long has it been since significant rainfall?
Or:
What did air pressure do when that storm arrived?
A long-running personal weather station gradually becomes a local climate archive.
That distinction between weather and climate is worth keeping in mind.
Weather tells me what the atmosphere is doing now and what it might do next.
Climate data gives that observation historical context.
32°C is a measurement.
32°C during an unusually long sequence of hot September days is a story.
Sometimes the signal comes from the other side of the planet
One of my favorite examples happened in January 2022.
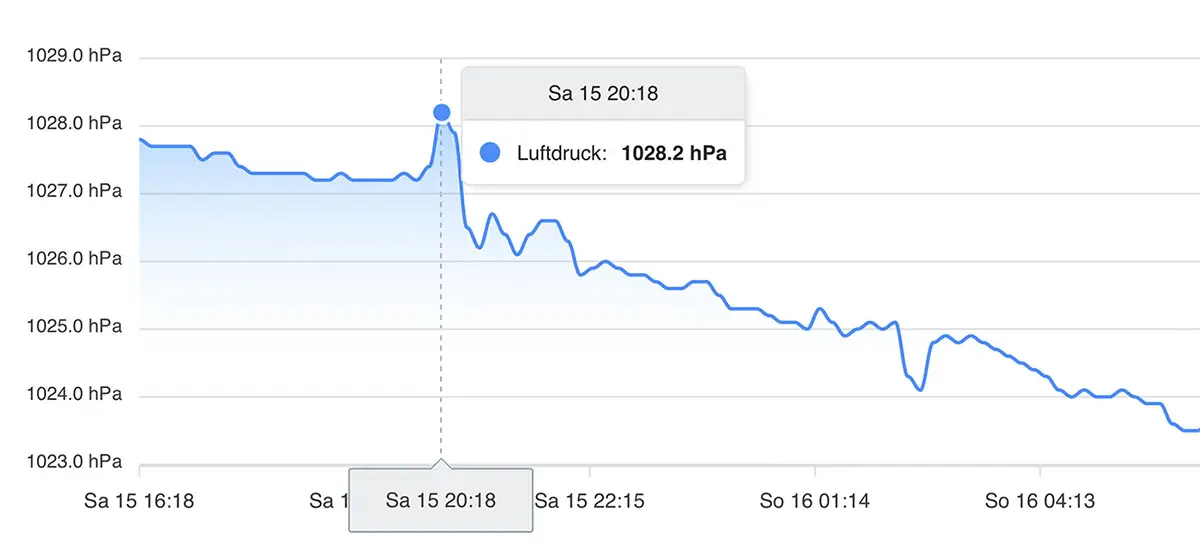
The enormous Hunga Tonga-Hunga Ha'apai volcanic eruption generated atmospheric pressure waves that traveled around the planet.
Those waves were measurable by weather stations thousands of kilometers away.
Including mine.
My garden weather station in Germany recorded the pressure disturbance from an eruption near Tonga.
I wrote a separate article about how my weather station detected the Tonga volcanic eruption.
That remains one of my favorite illustrations of why collecting environmental data is so fascinating.
A sensor in an ordinary garden can suddenly become one tiny observation point in a genuinely planetary event.
WeeWX, open source and my own weather software
My weather setup has always overlapped heavily with my software interests.
WeeWX is a lightweight open-source system written in Python that can communicate with many weather stations, store observations, generate reports and publish a complete weather website.
It is exactly the kind of software I like:
focused, extensible and perfectly happy running quietly on Linux for years.
At some point I also wanted the generated weather pages to look better and expose the archive more effectively.
So I built my own WeeWX skins.
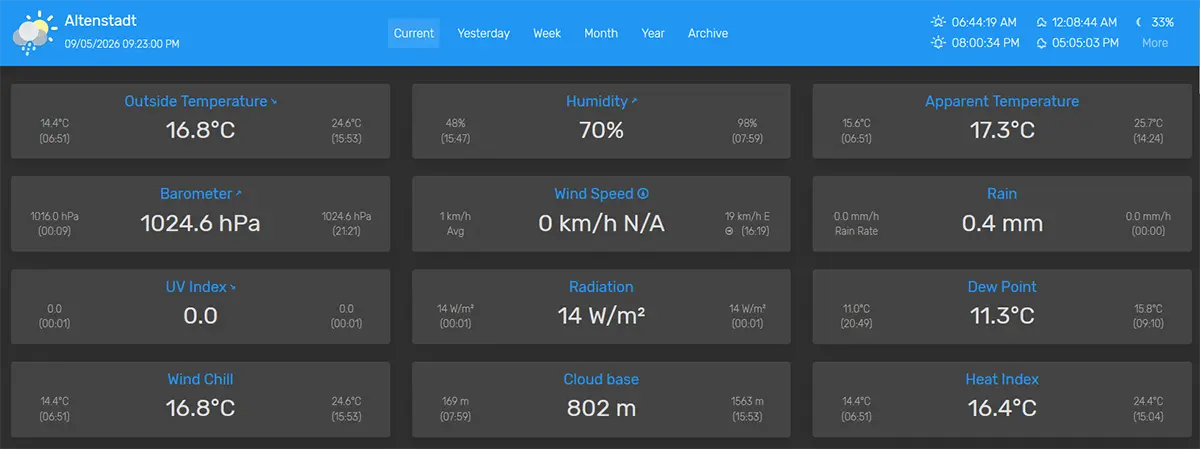
The current one is NeoWX Material, a responsive WeeWX skin with interactive charts, archives, a wind rose, dark mode, translations and support for a broad range of station sensors.
It grew from solving my own problem into something used by weather-station enthusiasts elsewhere.
Which is a recurring pattern with software projects.
You build the missing piece for yourself.
Then discover that other people were missing it too.
From a weather station toward BreezeBee
After more than a decade of minute-scale weather data, I keep thinking about the next layer.
Traditional weather-station software is very good at showing things like:
Temperature: 24.7°C Humidity: 61% Pressure: 1014.2 hPa
Useful.
But there is much more information hidden in the history.
The more interesting questions become:
- Is today unusually hot for this date?
- Was last night exceptionally warm?
- How does this summer compare with previous years?
- When did we last have such a dry period?
- Was today's rain event exceptional?
- How quickly did pressure fall ahead of that front?
- What changed immediately before a thunderstorm arrived?
- Which local weather patterns repeat?
That thinking is one of the directions behind a weather and environmental data platform I am exploring under the working name BreezeBee.
The basic idea is not merely to collect another number from another sensor.
It is to make long-running personal environmental data easier to understand.
There is a surprisingly large conceptual gap between:
data → graph → insight.
My weather station has accumulated enough history that this increasingly feels worth exploring properly.
You don't need my setup
This deserves emphasis.
You do not need:
- a Linux server,
- WeeWX,
- a database,
- a Davis station,
- ten years of history,
- custom software,
- or a concerning relationship with precipitation charts.
A perfectly reasonable progression is:
Level 1 — Use better weather information
Install the official weather app or bookmark your national weather service.
Learn to look at radar and understand it.
Use official warnings.
Level 2 — Understand the data
Learn what precipitation probability means.
Watch radar movement.
Compare forecast evolution.
Use lightning maps.
Level 3 — Measure your surroundings
Put a sensible temperature/humidity sensor outdoors.
Maybe add rainfall.
Maybe wind.
Level 4 — Log it
Use a station capable of storing or exporting data.
Now you can see days, months and seasons rather than isolated readings.
Level 5 — Become one of us
Connect it to Linux.
Install WeeWX.
Build dashboards.
Keep a decade of data.
Notice a volcanic eruption on the other side of Earth in your air-pressure graph.
Perfectly normal progression.
What about German commercial weather sites?
Germany also has plenty of commercial weather services:
- WetterOnline,
- wetter.com,
- wetter.de,
- Kachelmannwetter,
- and many others.
They are not inherently bad.
Some provide genuinely useful visualizations and specialist products.
Kachelmannwetter in particular can become very useful once you start wanting deeper access to radar and model output.
But when I'm simply trying to understand the weather in Germany, I generally prefer beginning with the DWD itself.
It is closer to the underlying public meteorological infrastructure, provides the official warnings, and makes an enormous amount of high-quality data available.
I am generally rather fond of public scientific infrastructure being accessible to the public that ultimately finances it.
Third-party services can then add convenience, interpretation or specialized interfaces on top.
A practical weather workflow
After all that, my actual process is remarkably simple.
“What's the weather tomorrow?”
I check the official forecast.
In Germany: WarnWetter.
If nothing unusual is happening, that's enough.
“Will it rain this afternoon?”
Official forecast first.
Then radar as the relevant time approaches.
“Will that rain hit us in 30 minutes?”
Radar.
I look at:
- direction,
- speed,
- recent development,
- structure,
- and whether the cell is strengthening or weakening.
“There is a thunderstorm warning. Are we getting one?”
Official warning first.
Then:
radar + LightningMaps.
And I keep checking if the situation is evolving quickly.
“What will the next few days look like?”
Official forecast.
If timing matters or the situation is uncertain, I may inspect Windy or multiple models.
“Why does Thursday's forecast keep changing?”
Probably because Thursday's atmosphere has not yet agreed to behave according to Monday's favourite model run.
Look at uncertainty rather than treating each forecast revision as incompetence.
“What is happening at your house right now?”
My weather station.
“Is this unusual?”
Now we leave weather forecasting and enter historical/climate data.
That's where the decade-long archive becomes useful.
My rule when traveling
When I arrive somewhere unfamiliar, my weather setup is basically:
- Find the national meteorological service.
- Find its warnings.
- Find local radar if available.
- Use LightningMaps for active thunderstorms.
- Use Windy for the bigger atmospheric picture.
- Use a generic forecast app for convenience when precision does not matter.
This works in Paris.
It works in Cork.
It works in California.
It works on a Mediterranean holiday.
The interfaces and datasets change.
The methodology doesn't.
Weather becomes much more useful once you stop asking one source to do everything
There probably isn't one perfect weather app.
And I don't particularly need one.
Weather is a continuously evolving physical system observed through many different instruments and approximated by many different models.
A simple phone forecast is useful precisely because it hides most of that complexity.
But when the answer matters, opening that complexity slightly gives you considerably more information.
Use the forecast for the forecast.
Use radar for precipitation that already exists.
Use lightning detection for thunderstorms.
Use warnings for hazards.
Use model maps for the larger picture.
Use a personal weather station for your actual location.
Use historical data when you want context.
And update your judgement as reality develops.
That's really my entire weather forecasting secret.
There is disappointingly little wizardry involved.
Just better inputs, the right tool for the question, and a willingness to look past the weather icon.
Noch keine Kommentare
Kommentar hinzufügen